

My current favorite Infographic about this defense. Unreal.
You must log in or # to comment.
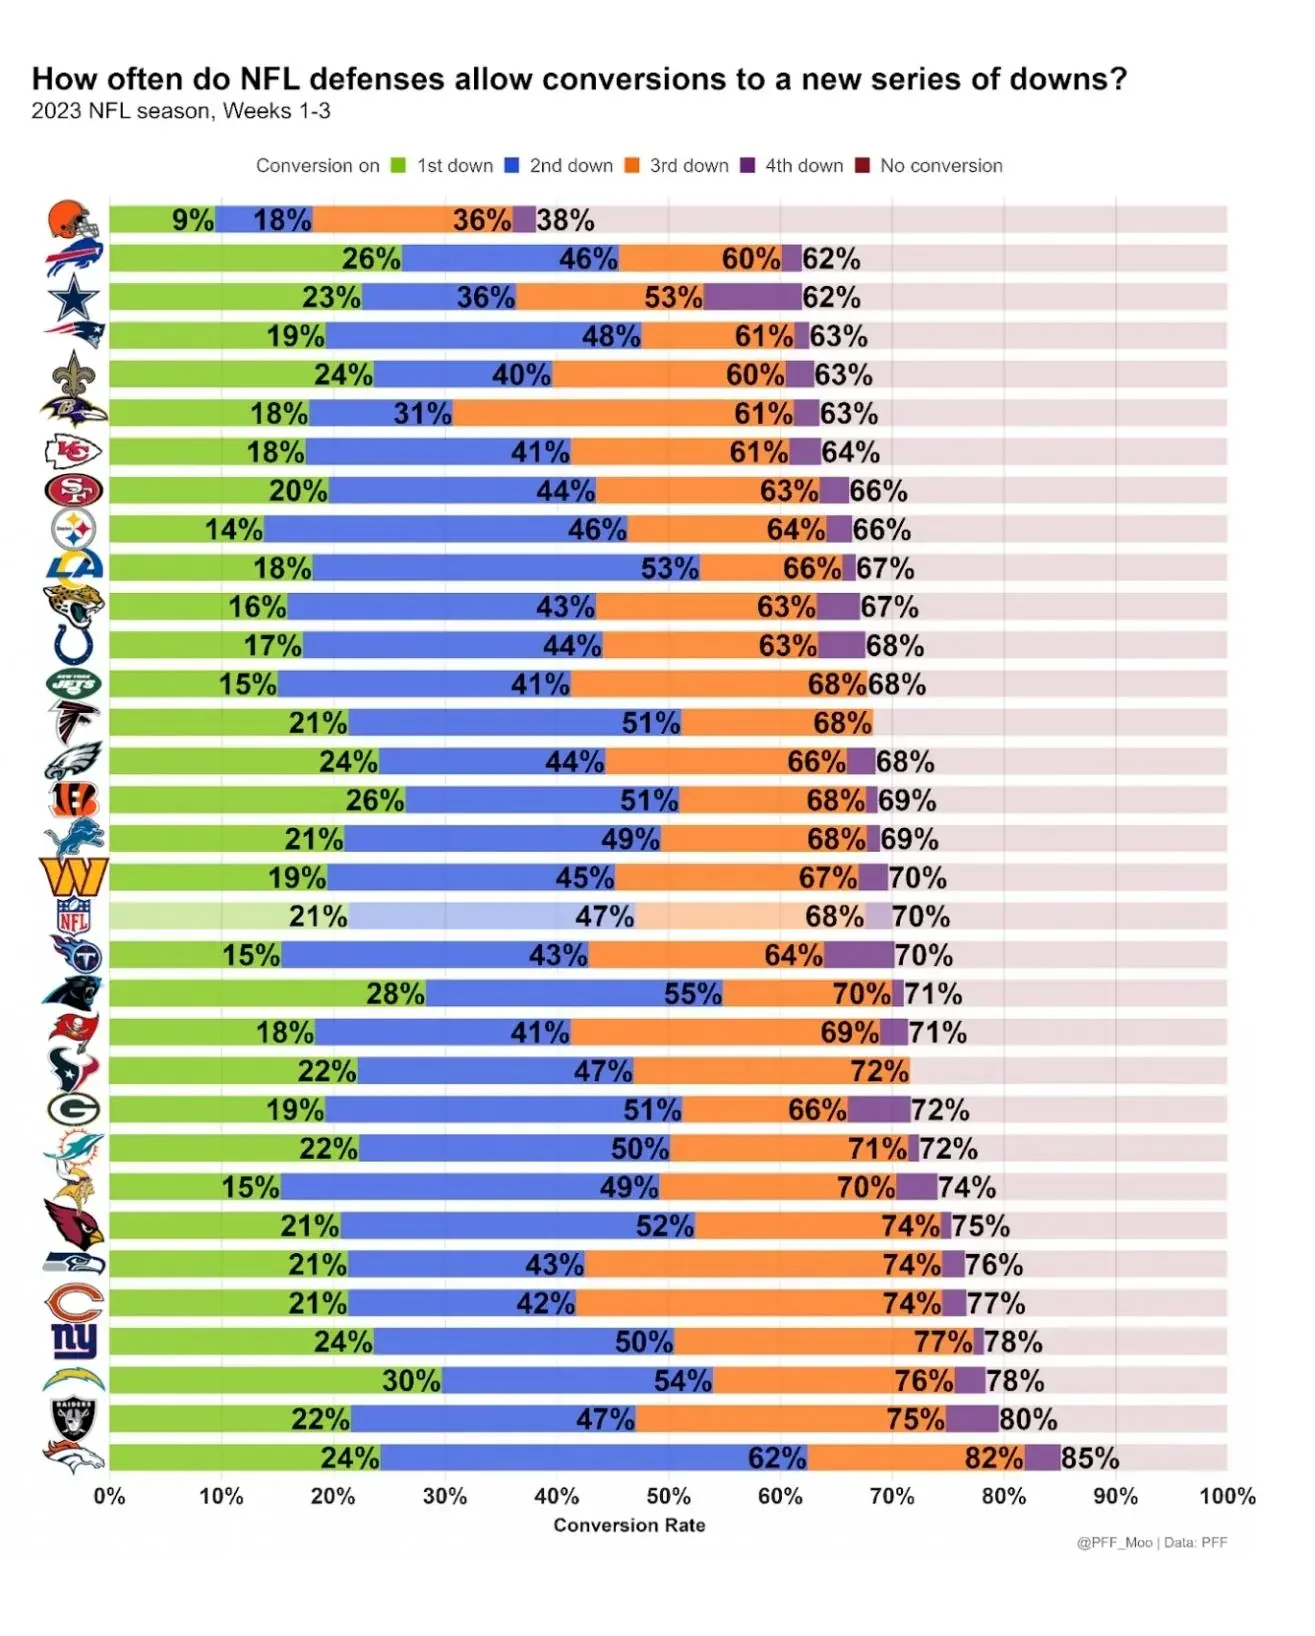
If I’m reading this graph correctly, it’s saying that x% of plays against the defense are conversions on that down? So, for the browns, 9% of all plays against their defense were conversions that happened on first down?
Essentially 9% of first down plays run against them resulted in a new set of downs. Then on second down, 9% of those plays resulted in new downs. Then on 3rs down that jumps by 18%. Astounding metric to say that teams are only getting a new set of downs only 36% after three tries. The league average is 68%!
