

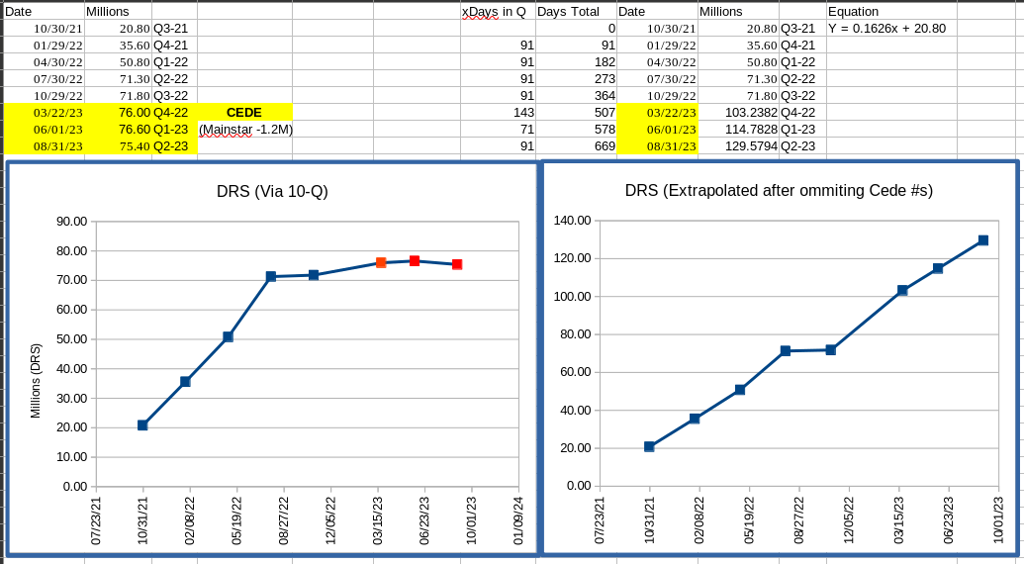
DRS in Millions (10-Q & 10-K)
- 10/30/21 20.80
- 01/29/22 35.60
- 04/30/22 50.80
- 07/30/22 71.30
- 10/29/22 71.80
- 03/22/23 76.00
- 06/01/23 76.60
- 08/31/23 75.40
DRS in Millions (What if Cede Would Lie?)
- 10/30/21 20.80
- 01/29/22 35.60
- 04/30/22 50.80
- 07/30/22 71.30
- 10/29/22 71.80
- 03/22/23 103.2382
- 06/01/23 114.7828
- 08/31/23 129.5794
It might be hard to visualize, but the last 3 fake data points do include a smaller slope by including the data point where we “only” added 0.5M in October of 2022.
But what if Cede fucked with the reporting for October specifically, knowing that the last 2 real data points (71.3 and 71.8) would only show a slope of ~0.5M a quarter?
Why do youyouyou think Gamestop changed the wording from 03/22/2023 onward?
I’m looking at the Numbers from the List of Stockholders you provided, and there are some wild statistics. For example the ‘mode’ for # of shares is 4 but the Std. Deviation is 3,121.
I noticed these too. I personally don’t take their estimation posts to heart because the calculations are inherently based on the numbers I’m saying are not being accurately relayed to us.