Sakowuf_Solutions@lemmy.world to flashlight@lemmy.worldEnglish · 1 year agoSW LED Spectramessage-squaremessage-square2fedilinkarrow-up15arrow-down10file-text
arrow-up15arrow-down1message-squareSW LED SpectraSakowuf_Solutions@lemmy.world to flashlight@lemmy.worldEnglish · 1 year agomessage-square2fedilinkfile-text
minus-squareSpicy3d@lemmy.worldlinkfedilinkEnglisharrow-up0·1 year agoWhat is the difference between these two plots? The first plot shows a single peak for all modes/filters, but the second plot shows the secondary peak at 395~405nm for the same emitter and modes. What’s going on here?
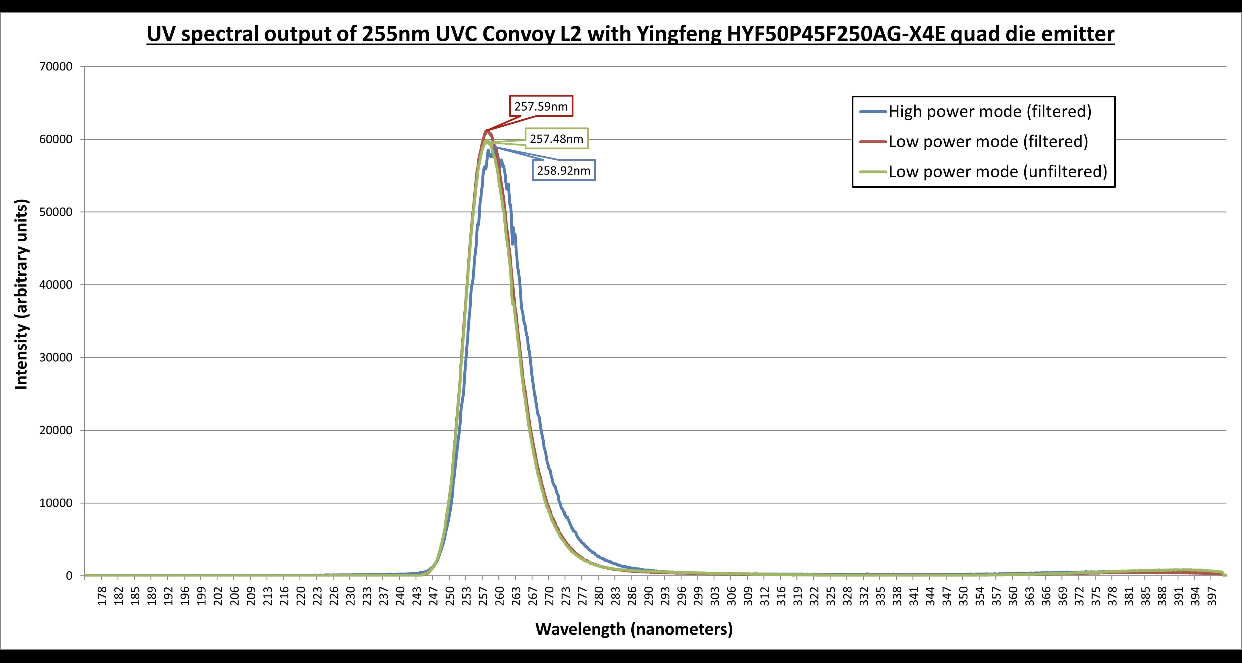
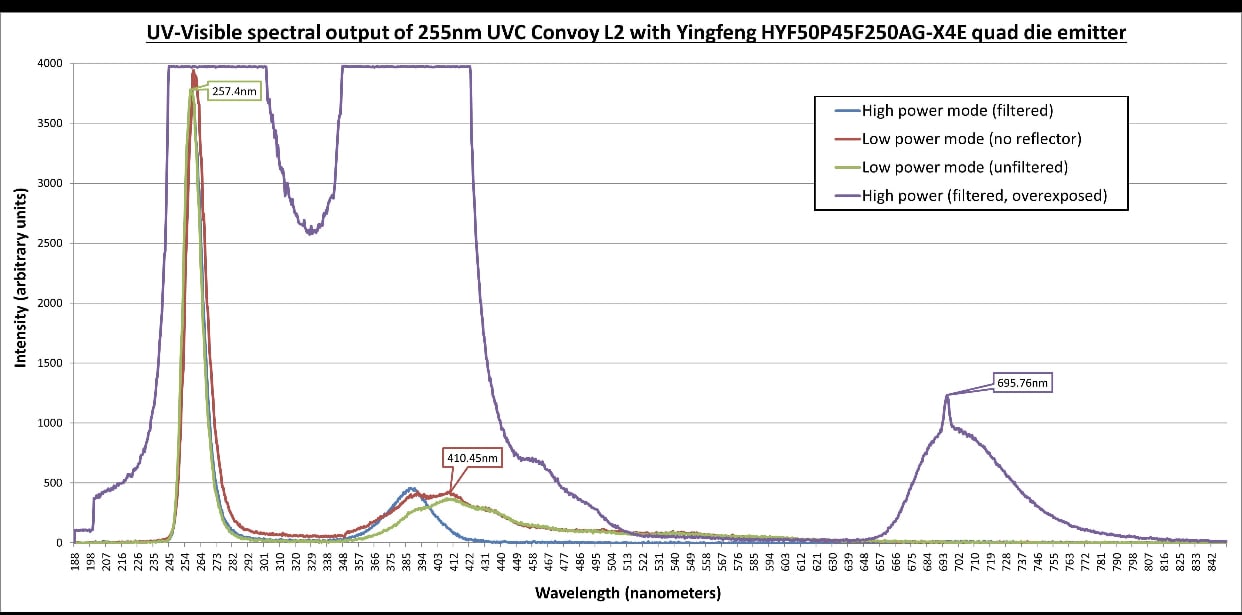
What is the difference between these two plots?
The first plot shows a single peak for all modes/filters, but the second plot shows the secondary peak at 395~405nm for the same emitter and modes. What’s going on here?