Since we’re directly comparing the price of a product over time, aren’t we already taking inflation into account? Like this is a direct depiction of inflation and the fact that minimum wage hasn’t kept up.
I think Red_Sunshine is referring to both compared to the CPI. Since 1980 the CPI has risen 355%, while the minimum wage has risen 233% and the big mac has risen 1600%. So the price of a big mac has outpaced CPI by a factor of nearly 5 while wages have underpaced by factor 0.66.
Damn, I would have expected it to be something that stuck close to the average inflation of all consumer products (CPI, I guess). Like that graph would be completely expected if we were talking about housing, but not a burger.


Since we’re directly comparing the price of a product over time, aren’t we already taking inflation into account? Like this is a direct depiction of inflation and the fact that minimum wage hasn’t kept up.
I think Red_Sunshine is referring to both compared to the CPI. Since 1980 the CPI has risen 355%, while the minimum wage has risen 233% and the big mac has risen 1600%. So the price of a big mac has outpaced CPI by a factor of nearly 5 while wages have underpaced by factor 0.66.
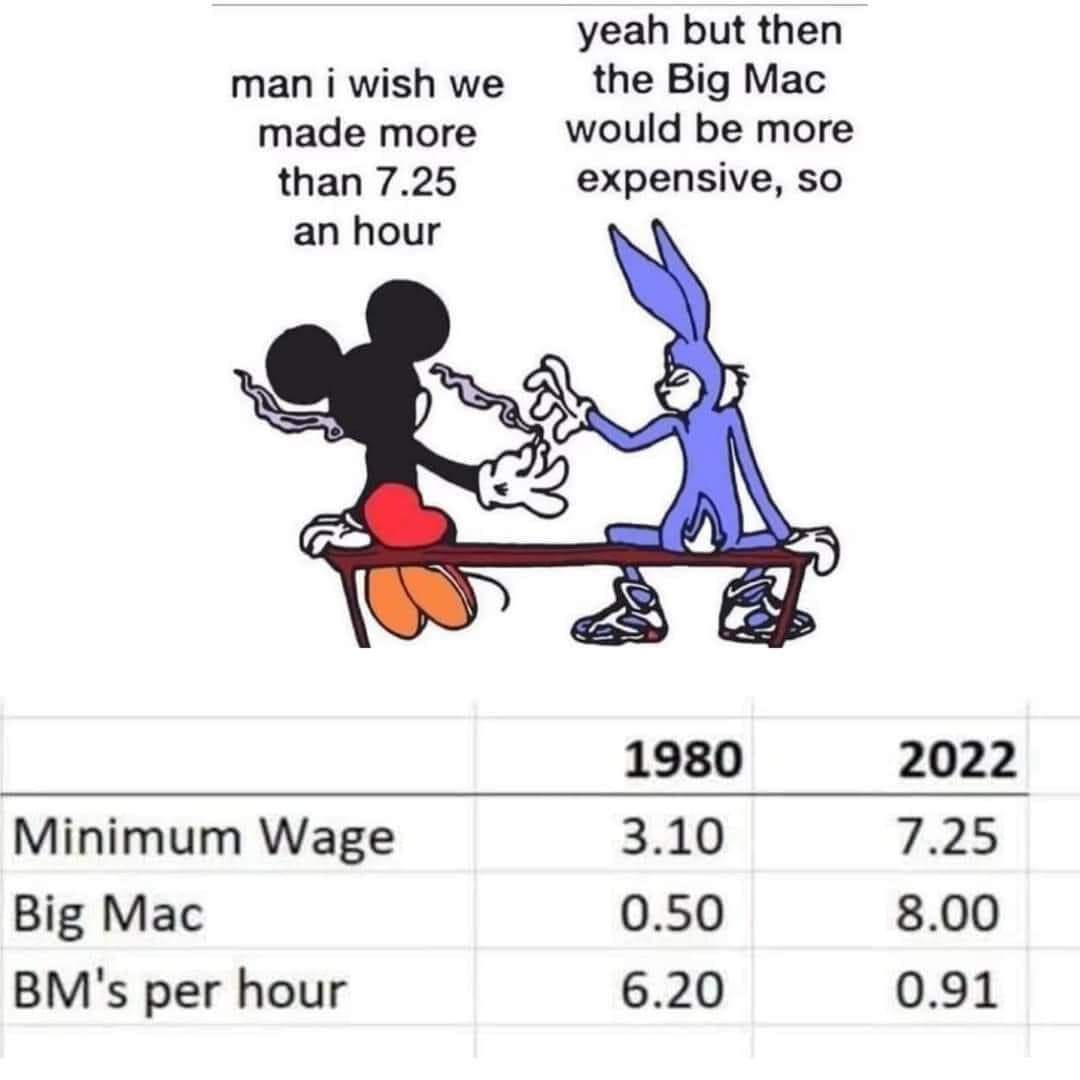
For visual learners:
Damn, I would have expected it to be something that stuck close to the average inflation of all consumer products (CPI, I guess). Like that graph would be completely expected if we were talking about housing, but not a burger.
What’s a product that has stuck close to CPI?
I think it hits harder if it’s in “units you can relate to on a visceral level”
I think “big macs per hour” is probably the most viscerally relatable metric for the average American