fossilesque@mander.xyzM to Science Memes@mander.xyzEnglish · 1 year agosomewhere a postdoc is cryingmander.xyzimagemessage-square36linkfedilinkarrow-up11Karrow-down12
arrow-up11Karrow-down1imagesomewhere a postdoc is cryingmander.xyzfossilesque@mander.xyzM to Science Memes@mander.xyzEnglish · 1 year agomessage-square36linkfedilink
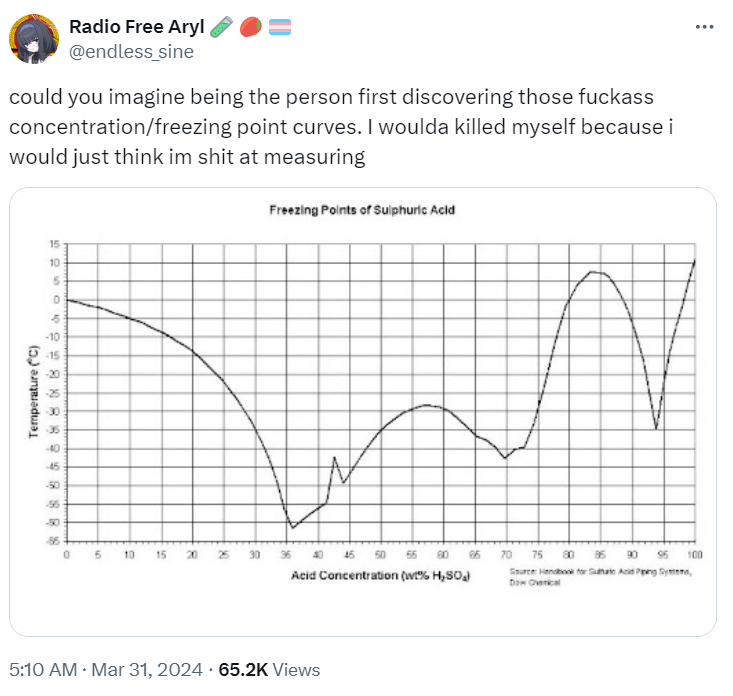
minus-squarePulptasticlinkfedilinkEnglisharrow-up12·1 year agoThat’s a phase diagram, there’s probably lots of cool things going on in the solid state below that line. Probably different ratio solids at each peak. 1:4 3:2 etc. The % are goofy because it is reported by weight but behaves based on count.


That’s a phase diagram, there’s probably lots of cool things going on in the solid state below that line. Probably different ratio solids at each peak. 1:4 3:2 etc. The % are goofy because it is reported by weight but behaves based on count.