
The share of women in the European Parliament has decreased for the tirst time ever.
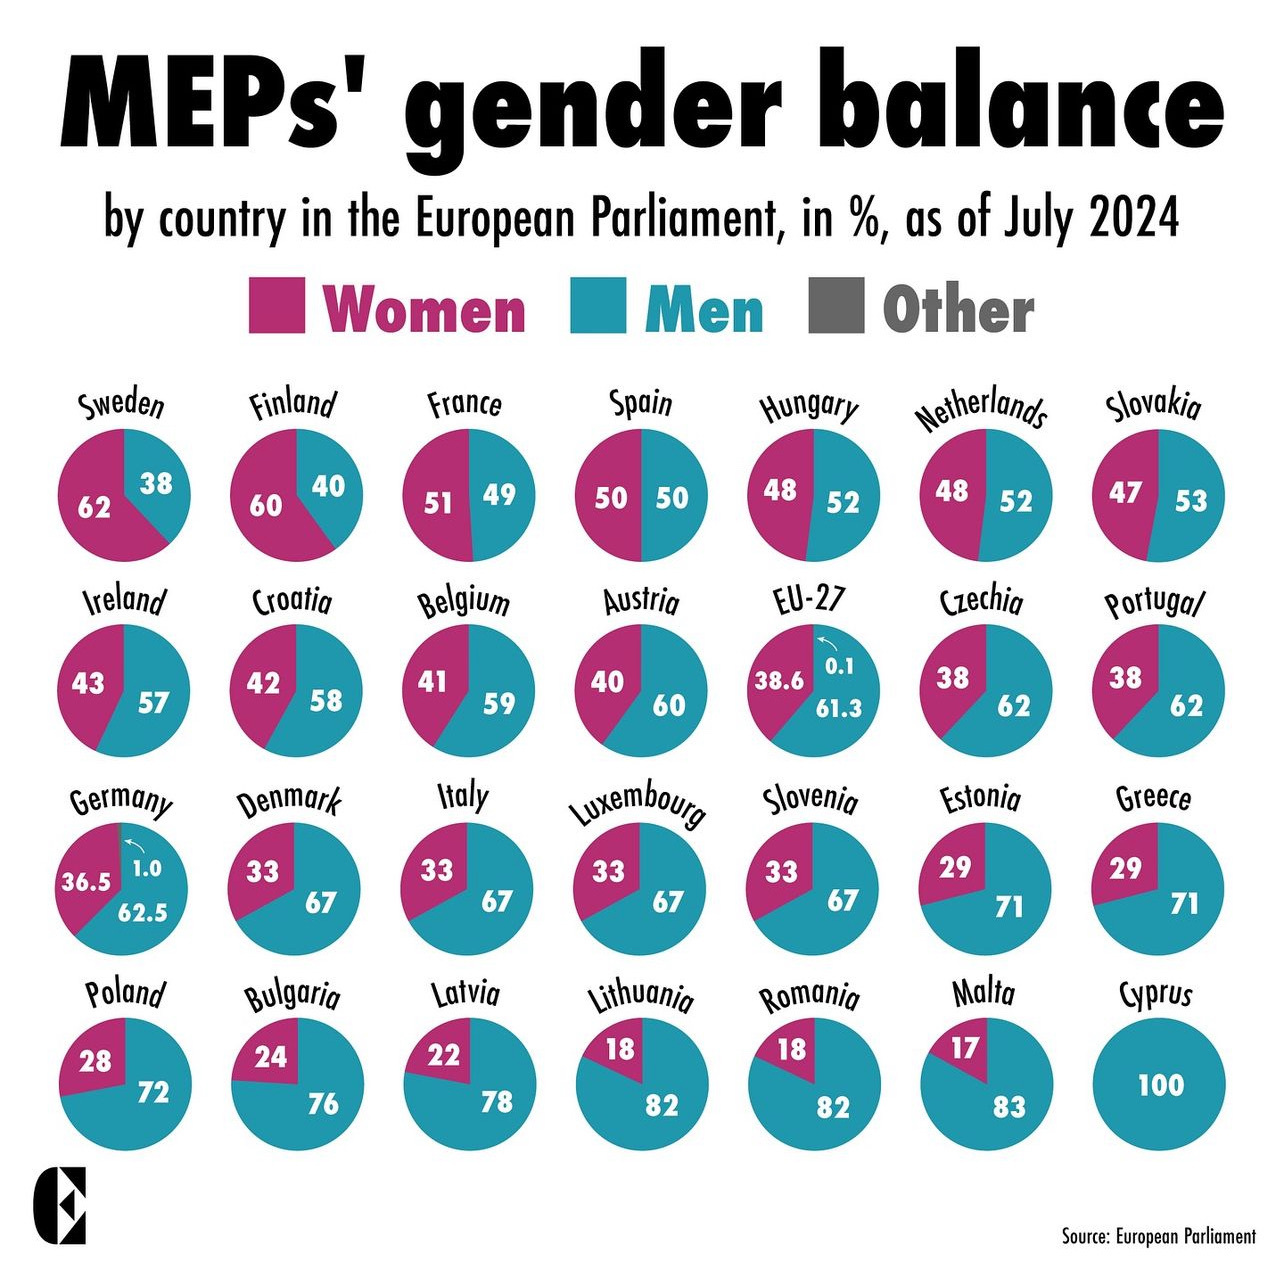
The newly elected European Parliament consists of 61.3% male, 38.6% female and 0.1% diverse MEPs. But what does it actually look like in the respective member states?
This visual illustrates the gender balance between female, male and diverse Members of the European Parliament (MEPs) in each member state.
Source: European Parliament
Who apart from you is rendering judgment here? The graphic is simply ordered by statistics, not “goodness”
You understand the graphic correctly. I’m affraid some people might not. I would prefer if the countries were ordered by most to least parity