The trend toward the Republican Party among white voters without a college degree has continued, and Democrats have lost ground among Hispanic voters, too.
I can post some sources but this is a bit misleading. There has been a significant drop in registered Democrats and Republicans over the last decade. There are more Independant registered voters than before. As a matter of fact the percentages flipped from being just under 30% as registered Independant to about 45% or so.
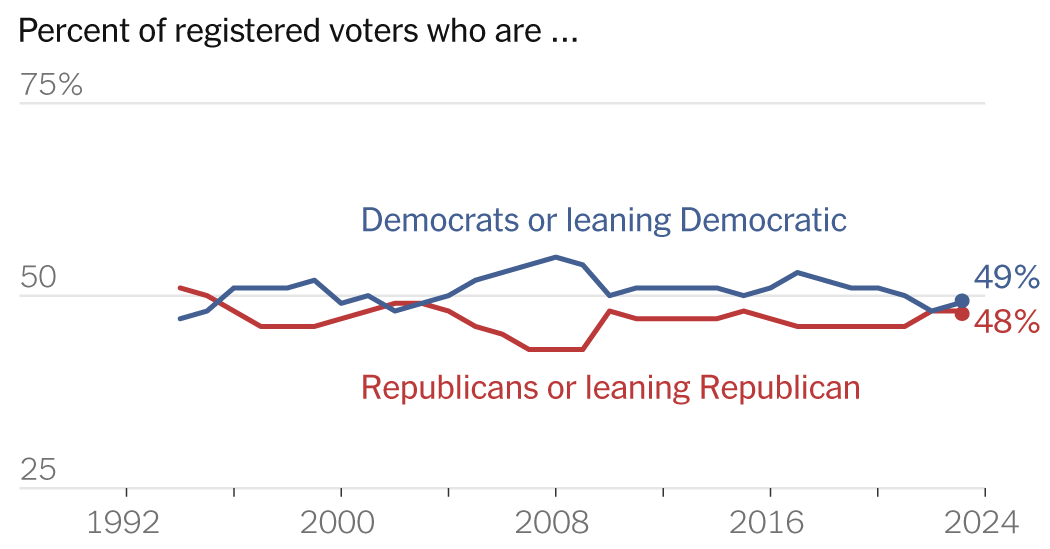
The “leaning” Democrat and Republican have stayed about the same and fairly even split but they aren’t “shifting to the Republican party”.
Since it looks exactly like the chart in the sources I’ve cited in the past here in the Fed, I’m sure the article (I didn’t bother looking at an archive to bypass the paywall) cites the same source that will show anyone that looks the truth.
One good example of this is Colorado, which has a large and growing percentage of Independents who have turned the state from deep red into a solid blue bastion for the Democrats.
The data cites identification as % of the total population though? And it isn’t just registration, it’s how people identify or lean. So I think this is a different source than yours. Can you share yours, since it seems to be at odds with this? Or maybe it’s just that more Is lean R
Looks like the graph from Gallup that I cited a few months ago in this post, though this one is updated. Though you should also combine that with Gallups data here around the same period where you can see though people as a part of that survey were identifying as Dem/Dem Leaning or Rep/Rep Leaning, specific parties affiliation shows a different picture (I cited that one here).
What I took away from that, that people that were Dem Leaning/Rep Leaning weren’t necessarily considering themselves as a part of either party but between 41 (2020) and 45% (2023) considered themselves Independent instead of identifying as an actual member of either caucus: Reps 30% (2020) and 27% (2022) vs. Dems 28% (2020) and 27% (2022).
I also wonder if they take into account strategic Voters I know this last few elections i am registered republican but I’m far left of democrats and vote for the weakest republican in the primary and vote dem in the general.

I can post some sources but this is a bit misleading. There has been a significant drop in registered Democrats and Republicans over the last decade. There are more Independant registered voters than before. As a matter of fact the percentages flipped from being just under 30% as registered Independant to about 45% or so.
The “leaning” Democrat and Republican have stayed about the same and fairly even split but they aren’t “shifting to the Republican party”.
Since it looks exactly like the chart in the sources I’ve cited in the past here in the Fed, I’m sure the article (I didn’t bother looking at an archive to bypass the paywall) cites the same source that will show anyone that looks the truth.
One good example of this is Colorado, which has a large and growing percentage of Independents who have turned the state from deep red into a solid blue bastion for the Democrats.
The data cites identification as % of the total population though? And it isn’t just registration, it’s how people identify or lean. So I think this is a different source than yours. Can you share yours, since it seems to be at odds with this? Or maybe it’s just that more Is lean R
Looks like the graph from Gallup that I cited a few months ago in this post, though this one is updated. Though you should also combine that with Gallups data here around the same period where you can see though people as a part of that survey were identifying as Dem/Dem Leaning or Rep/Rep Leaning, specific parties affiliation shows a different picture (I cited that one here).
What I took away from that, that people that were Dem Leaning/Rep Leaning weren’t necessarily considering themselves as a part of either party but between 41 (2020) and 45% (2023) considered themselves Independent instead of identifying as an actual member of either caucus: Reps 30% (2020) and 27% (2022) vs. Dems 28% (2020) and 27% (2022).
I also wonder if they take into account strategic Voters I know this last few elections i am registered republican but I’m far left of democrats and vote for the weakest republican in the primary and vote dem in the general.